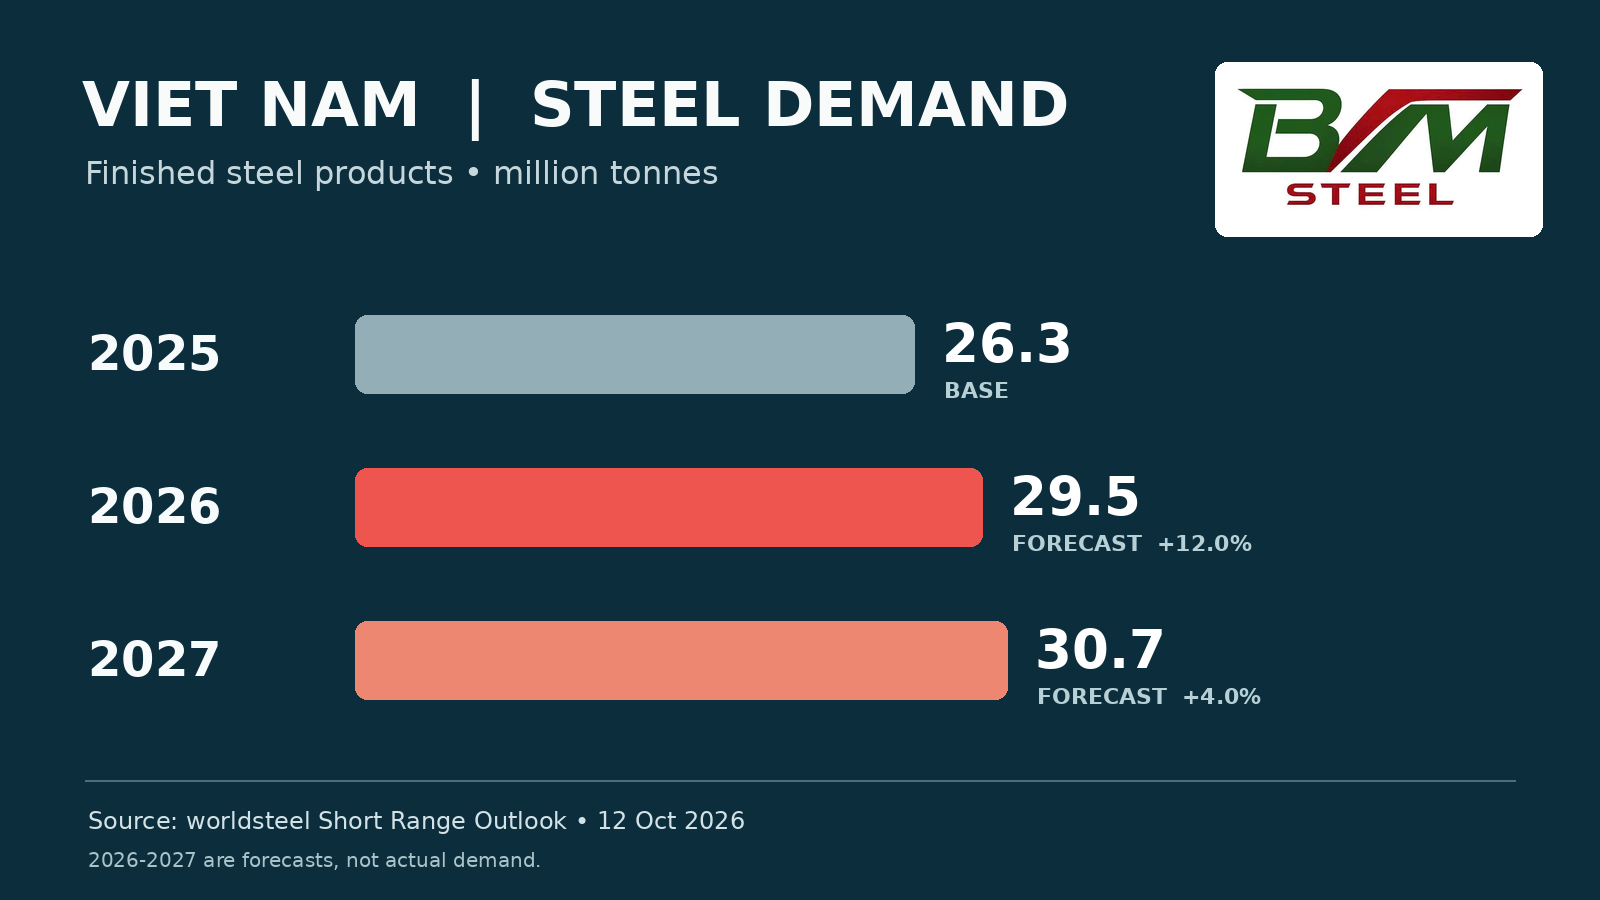
In its October 2026 Short Range Outlook, published 12 October 2026, worldsteel forecasts Viet Nam's finished steel apparent use at 29.5 million tonnes in 2026, up 12.0% from 26.3 million tonnes in 2025. Its 2027 forecast is 30.7 million tonnes, a further 4.0% increase. These are demand forecasts, not crude steel production or final 2026 results.
BVM editorial analysis, 13 October 2026. Source: worldsteel's release and original data tables. The outlook reflects information available through early September 2026.
A stronger Vietnamese forecast within a flat world market
The worldsteel table puts global finished steel demand at 1,722.2 million tonnes in 2026, down 0.1% year on year. Demand outside China is forecast to grow 1.5%, while the ASEAN-5 grouping grows 5.2% to 86.4 million tonnes. Viet Nam's 12.0% forecast exceeds that regional rate. The release rounds the Vietnamese figure to about 30 million tonnes; the table's precise forecast is 29.5 million tonnes.
For 2027, worldsteel projects growth of 1.7% globally, 3.2% for ASEAN-5 and 4.0% for Viet Nam. Annual demand growth should not be applied uniformly to every product category or delivery month.
What buyers and suppliers can do
BVM's practical reading: use the outlook to prepare supply capacity, then size inventory against actual projects and confirmed orders. Separate contracted volumes from probable quotations; set delivery windows by project phase. Confirm grade, standard, dimensions, tolerances, material certificates and acceptance terms before booking supply. For longer contracts, agree on quantity confirmation, staged delivery and a process for input-cost or schedule changes.
The figure concerns apparent use of finished steel products. It cannot be equated with crude steel output, imports, or demand for a particular grade. Compare reports only after aligning period, product scope and measurement unit. Sources: release; data tables. Cover image: BVM illustration, not a photograph of a named facility. Forecasts can be revised.